
Sign up today!
Join CoCoRaHS
Welcome to Connecticut CoCoRaHS!
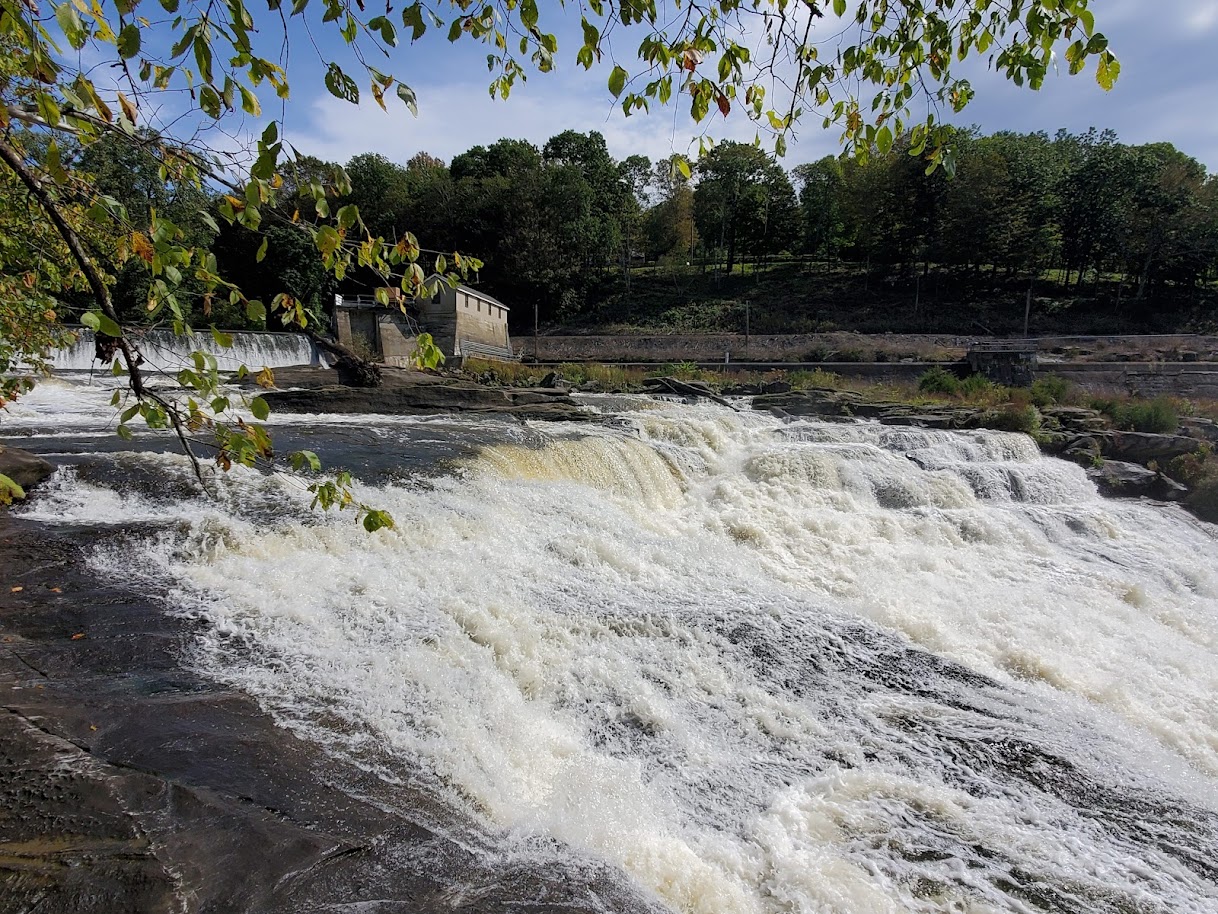
Falls Village CT, on the Housantonic River.
**
** We currently have 173 observers who reported daily precipitation during November 2021. **
Welcome to all of our new observers.
November 2021 averaged 134 Daily Reports per day.
*** WANTED ***
We strive to have an observer in every city and town in Connecticut.
Why CoCoRaHS?
We believe that precipitation is important and highly variable.
We believe that many other sources of precipitation data are not as accurate as ours.
We just happen to use low cost measuring tools and use the internet to make our reports.
If you believe what we believe, Join CoCoRaHS
One small measurement to make.
One giant impact that measurement makes upon the millions that depend upon water.
Have Questions or Would Like More Information?
Contact Matt Spies, Connecticut State Coordinator,
Joe Dellicarpini, Southern New England Coordinator,
or contact one your Regional Coordinator listed below
/
Southern New England CoCoRaHS Newsletters
(Thanks to our Editor, Matt Spies, CT-FR-9)
Latest Newsletter: December 2021: Dec2021SNE.pdf
Previous Newsletters:
November 2021: Nov2021SNE.pdf
October 2021: Oct2021SNE.pdf
September 2021: Sep2021SNE.pdf
August 2021: Aug2021SNE.pdf
July 2021: Jul2021SNE.pdf
June 2021: Jun2021SNE.pdf
May 2021: May2021SNE.pdf
April 2021: Apr2021SNE.pdf
March 2021: Mar2021SNE.pdf
February 2021: Feb2021SNE.pdf
January 2021: Jan2021SNE.pdf
December 2020: Dec2020SNE.pdf
November 2020: Nov2020SNE.pdf
October 2020: Oct2020SNE.pdf
September 2020: Sep2020SNE.pdf
August 2020: Aug2020SNE.pdf
July 2020: Jul2020SNE.pdf
June 2020: Jun2020SNE.pdf
May 2020: May2020SNE.pdf
April 2020: Apr2020SNE.pdf
March 2020: Mar2020SNE.pdf
February 2020: Feb2020SNE.pdf
January 2020: Jan2020SNE.pdf
December 2019: Dec2019SNE.pdf
November 2019: Nov2019SNE.pdf
October 2019: Oct2019SNE.pdf
September 2019: Sep2019SNE.pdf
August 2019: Aug2019SNE.pdf
July 2019: July2019SNE.pdf
June 2019: June2019SNE.pdf
May 2019: May2019SNE.pdf
April 2019: Apr2019SNE.pdf
March 2019: Mar2019SNE.pdf
February 2019: Feb2019SNE.pdf
January 2019: Jan2019SNE.pdf
December 2018: Dec2018SNE.pdf
November 2018: Nov2018SNE.pdf
October 2018: Oct2018SNE.pdf
September 2018: Sep2018SNE.pdf
August 2018: Aug2018SNE.pdf
July 2018: Jul2018SNE.pdf
June 2018: Jun2018SNE.pdf
May 2018: May2018SNE.pdf
April 2018: Apr2018SNE.pdf
March 2018: Mar2018SNE.pdf
February 2018: Feb2018SNE.pdf
January 2018: Jan2018SNE.pdf
December 2017: Dec2017SNE.pdf
November 2017: Nov2017SNE.pdf
October 2017: Oct2017SNE.pdf
September 2017: Sep2017SNE.pdf
August 2017: Aug2017SNE.pdf
July 2017: Jul2017SNE.pdf
June 2017: June2017SNE.pdf
May 2017: May2017SNE.pdf
April 2017: Apr2017SNE.pdf
March 2017: Mar2017SNE.pdf
February 2017: Feb2017SNE.pdf
January 2017: Jan2017SNE.pdf
December 2016: Dec2016SNE.pdf
November 2016: Nov2016SNE.pdf
October 2016: Oct2016SNE.pdf
September 2016: Sep2016SNE.pdf
August 2016: Aug2016SNE.pdf
July 2016: Jul2016SNE.pdf
June 2016: Jun2016SNE.pdf
May 2016: May2016SNE.pdf
April 2016: Apr2016SNE.pdf
March 2016: Mar2016SNE.pdf
February 2016: Feb2016SNE.pdf
January 2016: Jan2016SNE.pdf
December 2015: Dec2015SNE.pdf
November 2015: Nov2015SNE.pdf
October 2015: Oct2015SNE.pdf
September 2015: Sep2015SNE.pdf
August 2015: Aug2015SNE.pdf
#TBT: See How Far We've Come?
Summer 2009: Summer 2009.pdf
October 2009: October 2009.pdf
January 2010: January 2010.pdf
May 2010: May 2010.pdf
Summer 2011: Summer 2011.pdf
Winter 2011: Winter2011.pdf
Summer 2012: Summer 2012.pdf
Fall 2012: Fall 2012.pdf
Snowfall Reporting
Two page guide: Snow&SleetReporting.pdf
SWE Measurement from 2009: SWE Measurement.pdf
/Media/Docs/CT/Multi-Day Accumulationsv2 - reporting.pdf
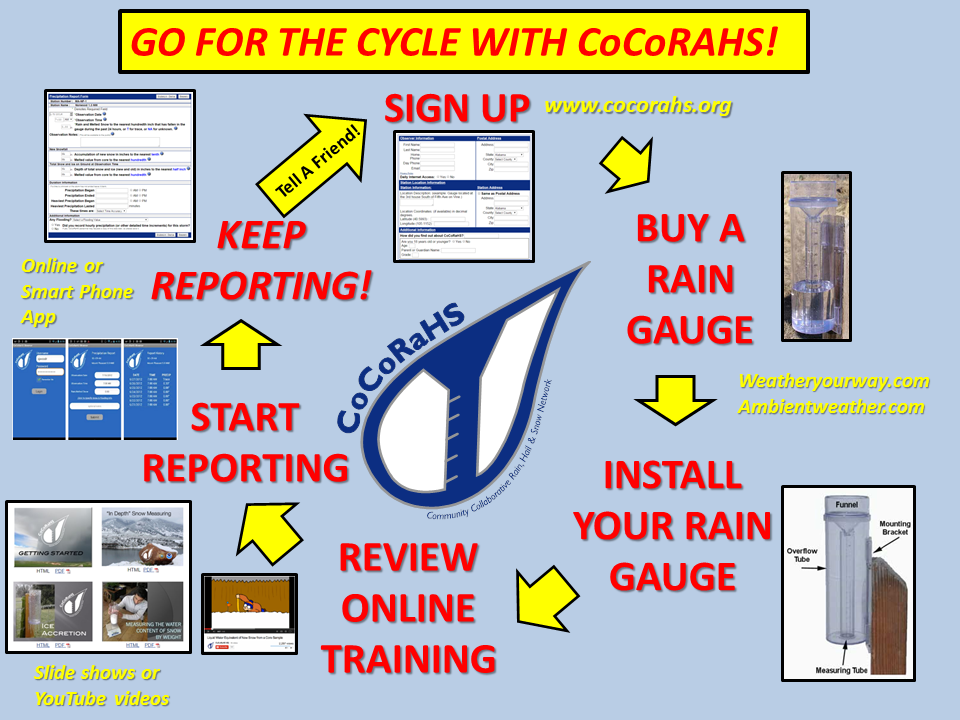
What Do I Need to Join?
We strongly encourage you to purchase a 4" diameter clear plastic rain gauge.
This will ensure that the data collected by CoCoRaHS observers are consistent through the nationwide network of observers,
The rain gauge costs $32 plus shipping and may be purchased at:
WeatherYourWay
Observer training can be accomplished by slideshows or by YouTube videos
Once you sign up, you will receive a login and password.
After you have a rain gauge and begin making observations, you can log in and report them.
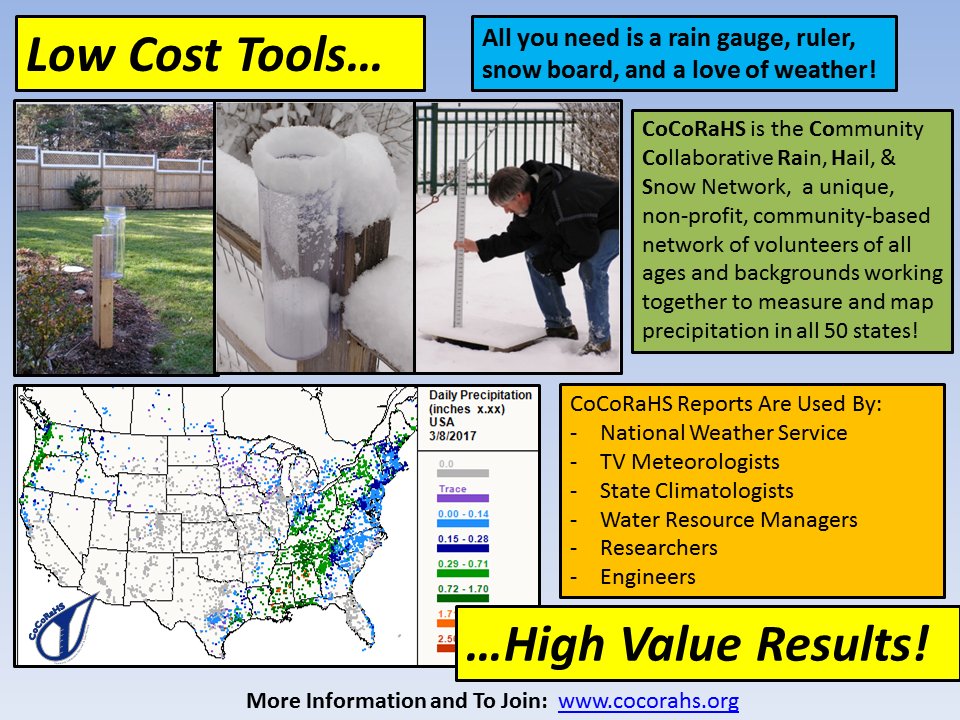
Your precipitation observations will appear on our maps.
How Is CoCoRaHS Data Used in Connecticut?
Some users of CoCoRaHS data include the National Weather Service (NWS), State and Local agencies, the media, and the public. For example, the NWS Northeast River Forecast Center uses daily precipitation data to supplement precipitation analyses, which are used to help predict river flows throughout the region. NWS Albany NY, Upton NY (New York City), and Taunton MA (Boston) use the data for drought analysis, post-event reviews, and to assist with the issuance of Flood Watches and Flood Warnings. The National Operational Hydrologic Remote Sensing Center (NOHRSC) uses reports from Connecticut observers to determine the impact of snow on the state's watersheds.
| 24-Hour Precipitation Reports Ending Around 7 AM |
Snow Guide: Snow Guide
Did You Know???
Connecticut averages between 40 and 50 inches of precipitation each year
Record for 24 hour rainfall: 12.77 inches in Burlington, Aug 19, 1955
Record maximum annual precipitation: 78.53 inches in Burlington, 1955
Record minimum annual precipitation: 23.60 inches in Baltic, 1965
Questions???
Contact Matt Spies, Connecticut State Coordinator,
Joe Dellicarpini, Southern New England Coordinator,
or contact one your Regional Coordinator listed below
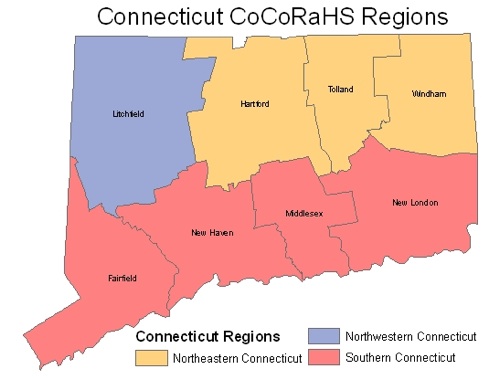
Connecticut CoCoRaHS Regional Coordinators
Northwest: Jennifer Vogt jennifer.vogt@noaa.gov
Christina Speciale christina.speciale@noaa.gov
Northeast: Bill Simpson william.simpson@noaa.gov
Southern: Tim Morrin timothy.morrin@noaa.govw
Connecticut CoCoRaHS is a collaboration between:
Colorado State University, National Weather Service Offices in Albany, New York City, and Taunton, and the Connecticut Department of Emergency Management and Homeland Security

